 512-710-7454


FetchITSoftware
FETCHIT! ANALYTICS
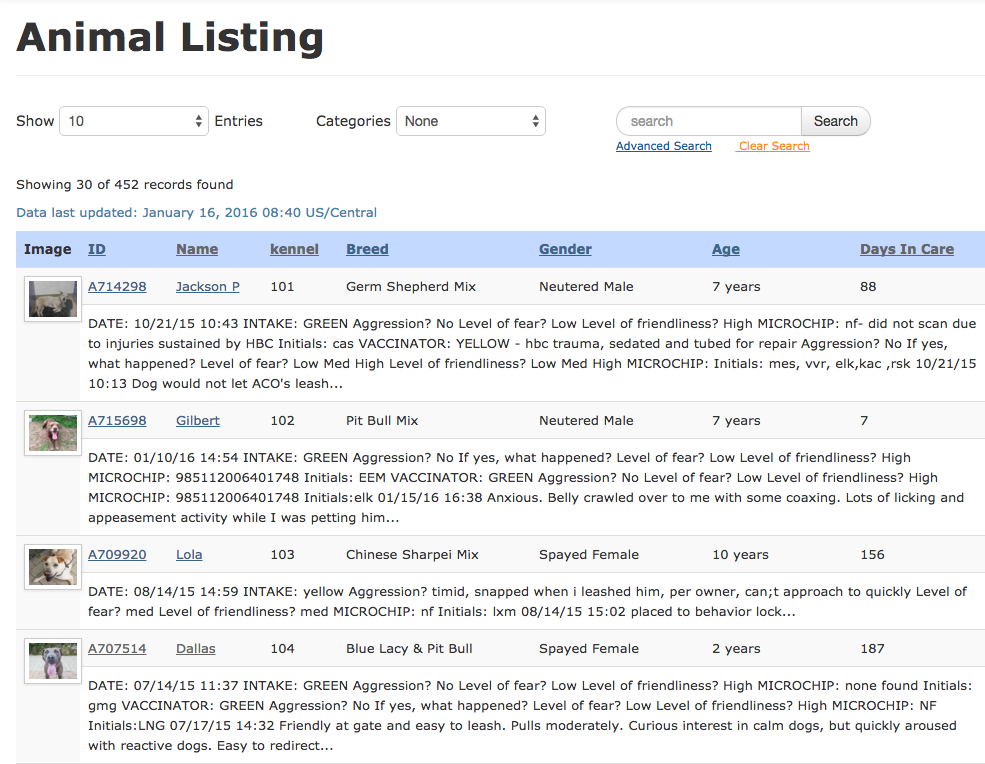
FetchIT! Analytics' searchable listing of animals enables staff, customers,
and volunteers find the animals they're looking for quickly and easily. Use it
as a customer service tool, a management tool, and embed it into your website so customers can use it.
Help customers find the cat or dog they're looking for.
Find It
Full text search allows you to find anything in the system.
Show It
Sortable columns allow you to list animals the way you want to see them.
Picture It
Photos help get animals adopted. Upload high-resolution photos and videos.
Categorize It
Create your own categories for customized listings.
Use It Everywhere
Works on your desktop, smart phone, or tablet.
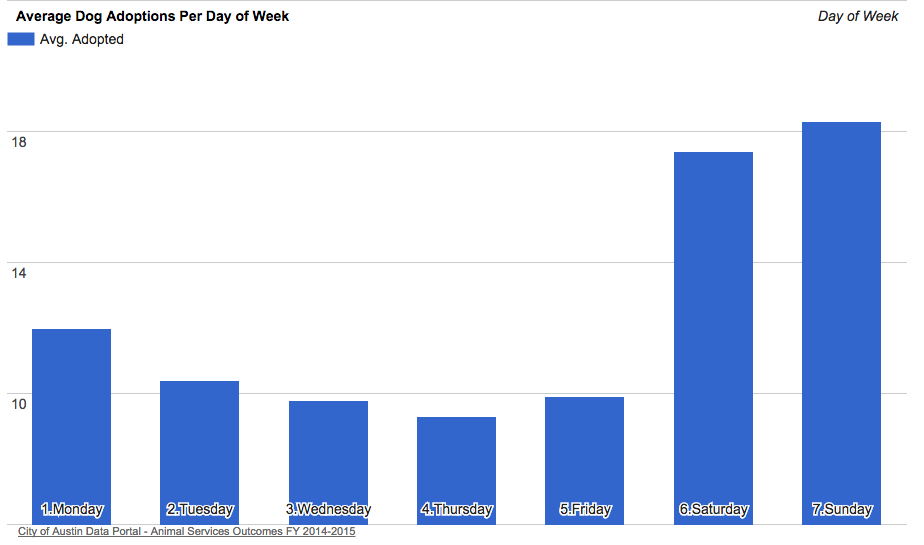
FetchIT! Analytics crunches the data from your legacy system to get actionable insights
that can improve operational efficiency and help get animals adopted.
Who knew Thursday was the slowest day of the week for adoptions?
Analyze It
Take the data you have and put it use - find the patterns, trends, and unexpected insights that our analytics provide through advanced metrics and charting.
Visualize It
A picture is worth a thousand words. FetchIT! Analytics shows you the results of its findings in easy-to-understand charts, graphs, and maps.
Act On It
Take the insights you've gained and use them to enhance your operational efficiency and help find animals homes sooner.
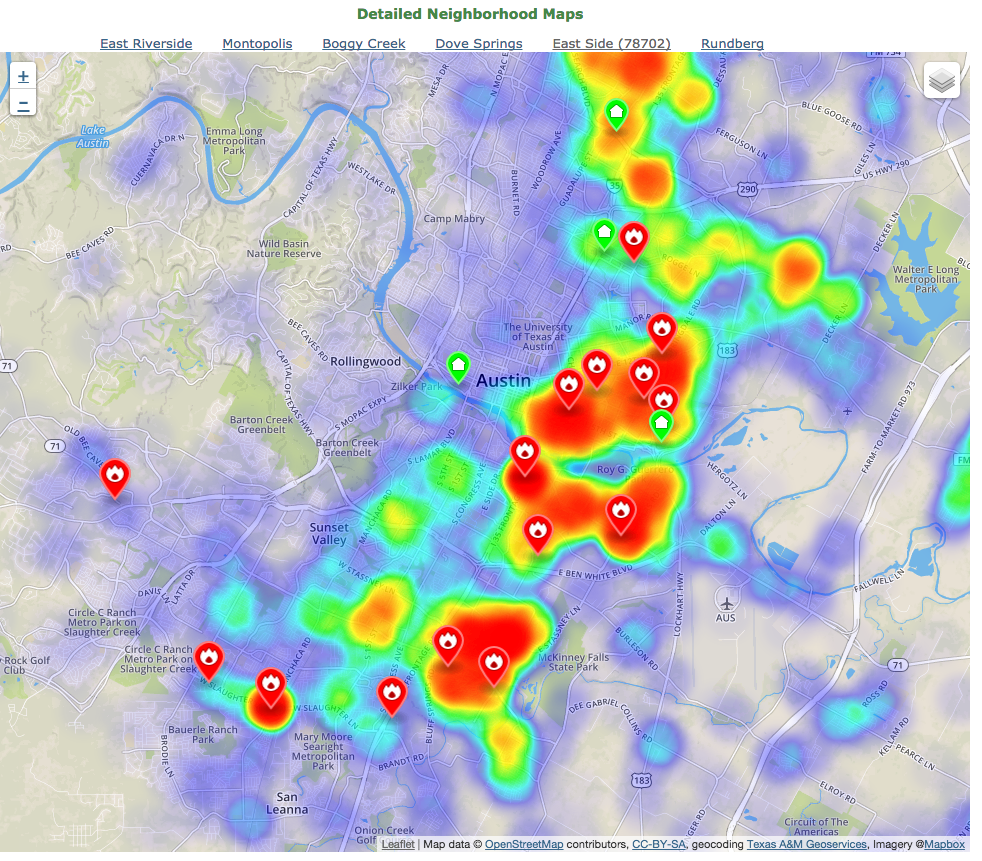
FetchIT! Analytics provides advanced visualization
and mapping capabilities to display complex data so that it can be easily understood.
You're looking at a heatmap of intakes in Austin, Texas and its surrounding county over
a 2-year period. The red icons are "hotspots" identified during analysis.
Now you can see where your intakes coming from.
Map It
Show where your intakes are coming from and where your outcomes are going to.
Understand It
Combine maps with advanced metrics and charting to get insights into what's happening and why.
Dig Deeper Into It
Drill down into the data, even to the neighborhood or street level.